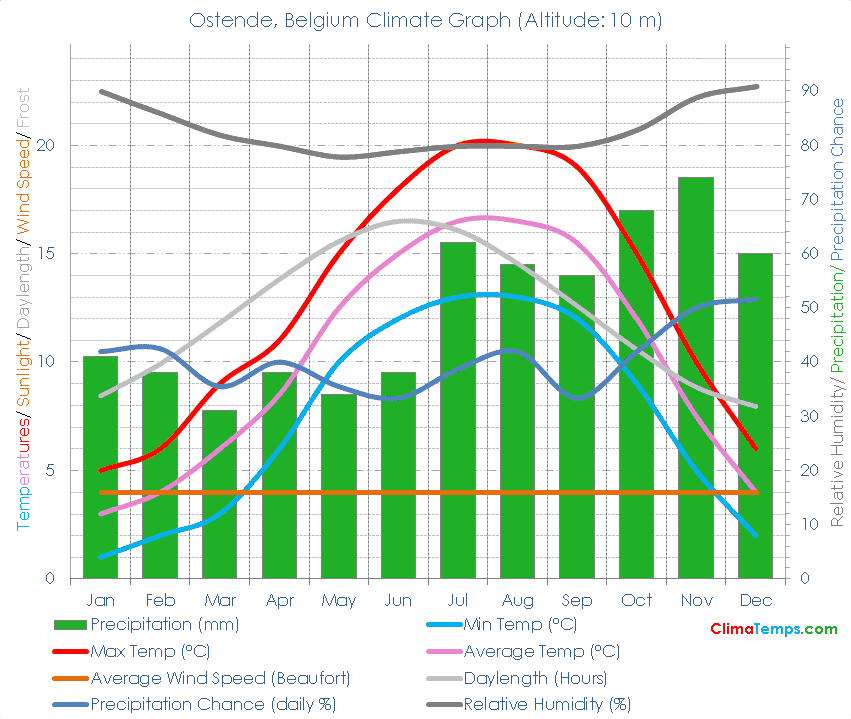
🌡️ The average temperature is 10.1 degrees Celsius (50.2 degrees Fahrenheit). See the temperatures page for a monthly breakdown and the fixed scale graph.
🐬 Average monthly temperatures vary by 13.5 °C (24.3°F). This indicates that the continentality type is oceanic, subtype truly oceanic.
☔ Total annual precipitation averages 598 mm (23.5 inches) which is equivalent to 598 Litres/m² (14.67 Gallons/ft²).
Simply paste the following HTML code into your webpage. Please include a link back to this website. There is one in the following code already. Edit the width attribute to change the size of the graph if needed:
In the winter time records indicate temperatures by day reach 5.7°C (42.2°F) on average falling to 1.7°C (35°F) overnight.
In spring time temperatures climb reaching 11.7°C (53°F) generally in the afternoon with overnight lows of 6.3°C (43.4°F).
During summer average high temperatures are 19.3°C (66.8°F) and average low temperatures are 12.7°C (54.8°F).
Come autumn/ fall temperatures decrease achieving average highs of 14.7°C (58.4°F) during the day and lows of 8.7°C (47.6°F) generally shortly after sunrise.
✨ The longest day of the year is 16:21 long on the 22 of June and the shortest day is 7:38 long on the 21 of December.
🐇Were you to burrow down through the centre of the Earth from Ostende you would pop up nearest to the climate station at Taiaroa Head, New Zealand where you would find a Marine west coast climate.
🌍Ostende, Belgium is at 51°13'N, 2°55'E, 10 m (33 ft). Check the location on the map.
| Climate Variable | Jan | Feb | Mar | Apr | May | Jun | Jul | Aug | Sep | Oct | Nov | Dec | Annual | ||
|---|---|---|---|---|---|---|---|---|---|---|---|---|---|---|---|
| Average Max Temperature °C ( °F) | 5 (41) | 6 (43) | 9 (48) | 11 (52) | 15 (59) | 18 (64) | 20 (68) | 20 (68) | 19 (66) | 15 (59) | 10 (50) | 6 (43) | 13 (55) | ||
| Average Temperature °C ( °F) | 3 (37) | 4 (39) | 6 (43) | 9 (47) | 13 (55) | 15 (59) | 17 (62) | 17 (62) | 16 (60) | 12 (54) | 8 (46) | 4 (39) | 10 (50) | ||
| Average Min Temperature °C ( °F) | 1 (34) | 2 (36) | 3 (37) | 6 (43) | 10 (50) | 12 (54) | 13 (55) | 13 (55) | 12 (54) | 9 (48) | 5 (41) | 2 (36) | 7 (45) | ||
| Average Precipitation mm (in) | 41 (2) | 38 (1) | 31 (1) | 38 (1) | 34 (1) | 38 (1) | 62 (2) | 58 (2) | 56 (2) | 68 (3) | 74 (3) | 60 (2) | 598 (24) | ||
| Number of Wet Days (probability of rain on a day %) | 13 (42) | 12 (42) | 11 (35) | 12 (40) | 11 (35) | 10 (33) | 12 (39) | 13 (42) | 10 (33) | 13 (42) | 15 (50) | 16 (52) | 148 (41) | ||
| Average Daylight Hours/ Day | 8h 26' | 9h 54' | 11h 48' | 13h 48' | 15h 33' | 16h 29' | 16h 04' | 14h 32' | 12h 35' | 10h 34' | 8h 50' | 7h 57' | 12h 00' | ||
| Sun altitude at solar noon on the 21st day (°). | 18.9 | 28.2 | 39.1 | 50.7 | 59 | 62.2 | 59.2 | 50.8 | 39.4 | 27.9 | 18.8 | 15.4 | 39.1 |
Please take a moment to share a climate graph or simply the address:
Thank You, so much! ❤️